FEATURES
Data Download
Reports
WebFilm® CMS
How It Works - Cloud Computing
SMART Enterprise
SurePoint™
LIVE SITES
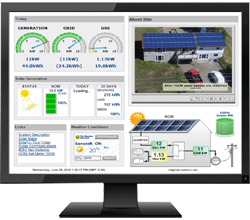
Dashboard for output
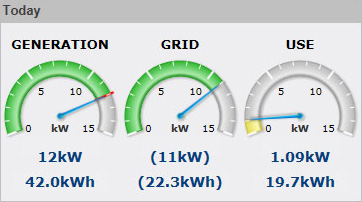
Separate meters are provided showing power from solar generation, grid import/export and used by loads. On sunny days when generation exceeds usage, the GRID meter will be green to indicate power is being exported to the grid for a credit.
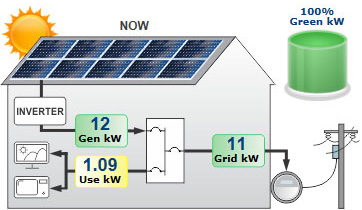
Track live power flow
To get a better understanding of sustainability, watch how solar generation and power use interact to make a smaller carbon footprint. When the green gage is at 100% the grid meter is "spinning backwards" and the system is earning power credits.
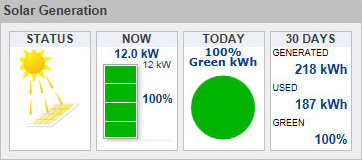
Generation status
See how close to full capacity the solar panels are producing now. Check progress of green energy production throughout the day . Get a snapshot of the how green the system has been for the last month.
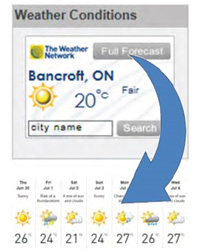
Weather Conditions
Compare generation to actual weather conditions. Click the link for a long range forecast for this location.
Show site
Create a slideshow of photos and graphics using WebFilm for public display or access from a mobile device. Net metered distributed generation is a major trend for addressing climate change which is receiving considerable interest.